Principles of Data Graphics
Cost: $650.00
5 online sessions
Tuesdays, April 21–May 19, 2026
5:00 pm–8:00 pm
Data graphics are magical. They help us discover and discuss otherwise invisible phenomena.
We will dissect the elements that make charts and maps spectacular. Each session will focus on a specific aspect of information design, ranging from choosing effective visual metaphors to visualizing uncertainty to the subtle art of color-encoding. Throughout our critiquing and making, the emphasis will be on the hard human decisions necessary to create effective data graphics.
This class’s perspective is technology-agnostic. You should arrive able to
- Sketch simple geometries with paper and pencil
- Make a bar chart and line graph in a web tool like Google Sheets or Datawrapper
- Composite graphics and text in a design tool like Illustrator or Figma
- Spend a couple extra hours each week developing your own charts
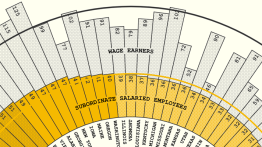
Each session will be anchored by a masterpiece of information design. We will discuss not just the aspects that make each piece effective, but also the craft and context of its creation, gaining insights into how great information design actually happens.
Additionally, sessions will include data-sketching warm-ups, presentation of information-design theory, and review of take-home exercises. We will learn through mutual reflection and constructive critique of one another’s work. The engaged student will emerge from the class with more capabilities and enthusiasm for data graphics.
This class is limited to 14 students.
Course Code: PDG0426
Instructor(s): RJ Andrews