COVID-19 Compiler Transforms Pandemic Data
POSTED ON: April 24, 2020
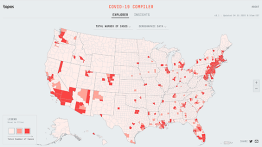
The COVID-19 Compiler, from the Topos website
At a moment where “pivoting” has become the byword for many small businesses, Topos, a company co-founded by Will Shapiro AR’13 that is focused on transforming the understanding of cities using Artificial Intelligence, has gone from being totally devastated by the COVID-19 crisis to parsing the pandemic data for the public good. The result, the COVID-19 Compiler, has gained the attention of healthcare and public policy professionals, as well as media like The Rachel Maddow Show.
“The mission of the company is to use big data and artificial intelligence to understand cities and neighborhoods and location more broadly,” Shapiro says. “In general, people look at the census and vehicle counts and foot traffic and other standard metrics to understand place. What we really focused on is understanding place in a much more multidimensional and culturally nuanced way. We look at stuff like, What kind of coffee are people drinking in a given area? Dunkin Donuts, or from like a cool third wave coffee shop? What kind of music do they listen to? What does the architecture look like? We focused on the retail and hospitality industries, trying to put some intelligence behind the ways that businesses open new locations.”
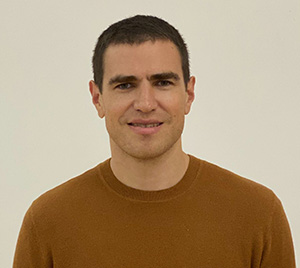
Then the COVID-19 crisis hit, putting all that on pause. “Our core technologies are super flexible, so we'd always been interested in a wide variety of applications,” Shapiro says. “We realized that we already had a lot of the underlying technology to start building this multidimensional view of the pandemic.”
Their map of the U.S., divided by counties, displays the latest data on COVID-19-related infection and deaths supplied from the likes of the CDC. Then it allows a user to layer on other dimensions like population density, public transportation use or ethnographic data, culled, aggregated and disaggregated by Topos. The results are color-coded.
It shows, for example, how cases have spiked in “resort communities”, despite their affluence, due to urbanites fleeing to their second homes, bringing the virus with them and surging the local populations. You can also see that, on the other end of the socio-economic spectrum, counties that have both high populations of people of color and high COVID-related morbidity rate are mostly found in the Southern United States. Counties with comparable percentages of people of color located in the Northern U.S. show fewer rates of COVID infection.
“Traditional epidemiology has a very different perspective on trying to understand the spread of disease. A lot of it is done in laboratories where you're measuring data like how long the virus will live on a variety of surfaces, but less so factors like public transportation use, or what percentage of people in a given area live in apartment buildings with over 50 units. All of these factors really speak to people being together physically and are critical for understanding how COVID is spreading.”
Shapiro, who was born in New York City but grew up around Boston, found his way to Cooper after a circuitous route that started in a specialized arts high school and then earned him a bachelor’s degree in math from Brown University before he even showed up for his first day at The Irwin S. Chanin School of Architecture. He has been teaching as an assistant adjunct professor at the school since the year of his graduation, focusing, unsurprisingly, on interdisciplinary work that crosses over with the Albert Nerken School of Engineering. While an architecture background may not seem immediately applicable to data-crunching, Shapiro can identify exactly how his education plays a role in his work.
“The discipline of architecture has been critical in shaping the way I think about humans’ interaction with software, digital technologies, and data. The design challenges of architectural representation -- which involve concisely representing incredibly complex systems such as structures, HVAC, circulation, etc. in the most precise manner allowed by the chosen medium -- is very much relevant to thinking about how to represent complex datasets with millions of points and thousands of dimensions. The technology we've developed as a company is a scalable, automated, wholistic understanding of cities, neighborhoods and locations more broadly. A core aspect of that is understanding the form of cities and neighborhoods through the use of various computer vision technologies. All of this is very much informed by the tradition of formal analysis at Cooper, extending back to the foundational pedagogy of Hejduk, Eisenman, Lewis and others.”

